

The words “change management” can send chills down a network security engineer’s spine. Most view change management as a necessary evil involving approvals and tedious documentation but it is vitally important. Without a change management strategy the network can change on the fly and risk increases dramatically. Temporary firewall rules for testing a fix can be left behind, compromised accounts can make undetected changes to configuration, and proper understanding of changes and their impact can be missed.
While organizations can be proactive about change management and ensuring changes are approved; safeguards are needed to detect when changes occur to ensure they are expected and within the scope expected. FortiGate creates several log entries when configuration changes occur. We can leverage Event Handlers in FortiAnalyzer to recognize these and alert on occurrence. FortiAnalyzer Playbooks can take this to the next level and create an incident, run a report, and attach a report of the configuration changes to the incident. The reports can be used in investigating an unexpected change or change evidence for an approved change.
As mentioned FortiGate has a few log entries for changes that can be monitored:
- LogID 0100044547: Object attribute configured – log entry is generated immediately after a change occurs, such as deleting an address object.
- LogID 0100032102: Configuration changed – log entry is generated upon an administrator logout if any configuration has been modified. This triggers if there are changes on GUI, SSH, or CLI widget.
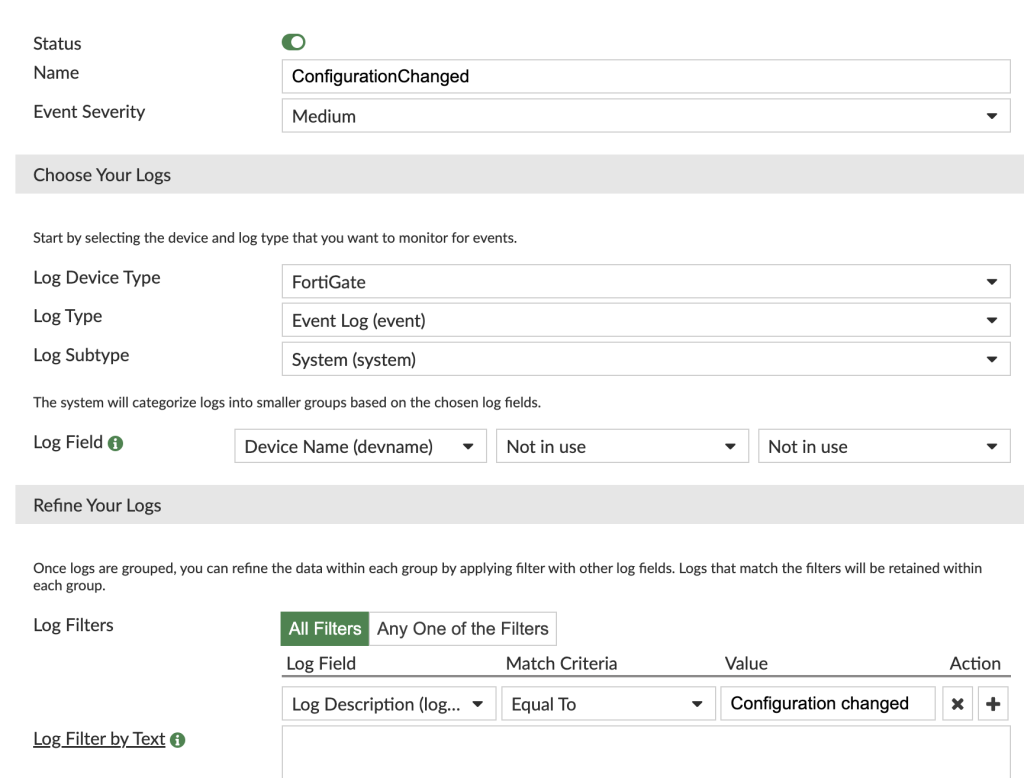
I’ve chosen to create the Event Handler needed for this use case based on the “Configuration changed” log id to help reduce the number of incidents and email notifications. There could be numerous changes an administrator makes while logged in and if the handler is built on the “Object configured attribute” log id this will result in an incident for each individual item changed. The individual “Object configured attribute” events will be in FortiGate and FortiAnalyzer logs as well as in the report that will run in the playbook so I don’t feel I need notification on them. There is a chance for double incidents if an administrator changes configuration in both the GUI and CLI widget, but without monitoring the CLI widget if an administrator logged into the GUI and then only made changes on the CLI widget the event handler would not trigger.
The Playbook created here will trigger on an Event Handler monitoring for the “Configuration changed” logid. The Event Handler will send email notification that the log has been detected. The Playbook will complete the following:
- Create an incident
- Retrieve the relevant log entries that triggered the event and attach to the incident
- Run a report to capture configuration changes in the previous 24 hours
- Attach report to the incident
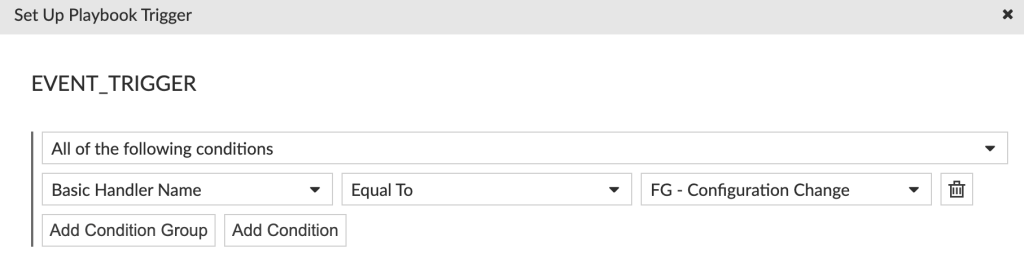
Now that the stage is set, let’s get started with a familiar task – creating an Event Handler. Since I’ve covered Event Handlers in a previous post I’ll just highlight the rule in the EH here:
The next item needed is a report that captures configuration changes. FortiAnalyzer has many built in reports with corresponding datasets and charts. There is a built-in report “What is New” in the FortiGate section which shows various new items including users, devices, security threats, and configuration changes. We will use the configuration changes chart in a new report.
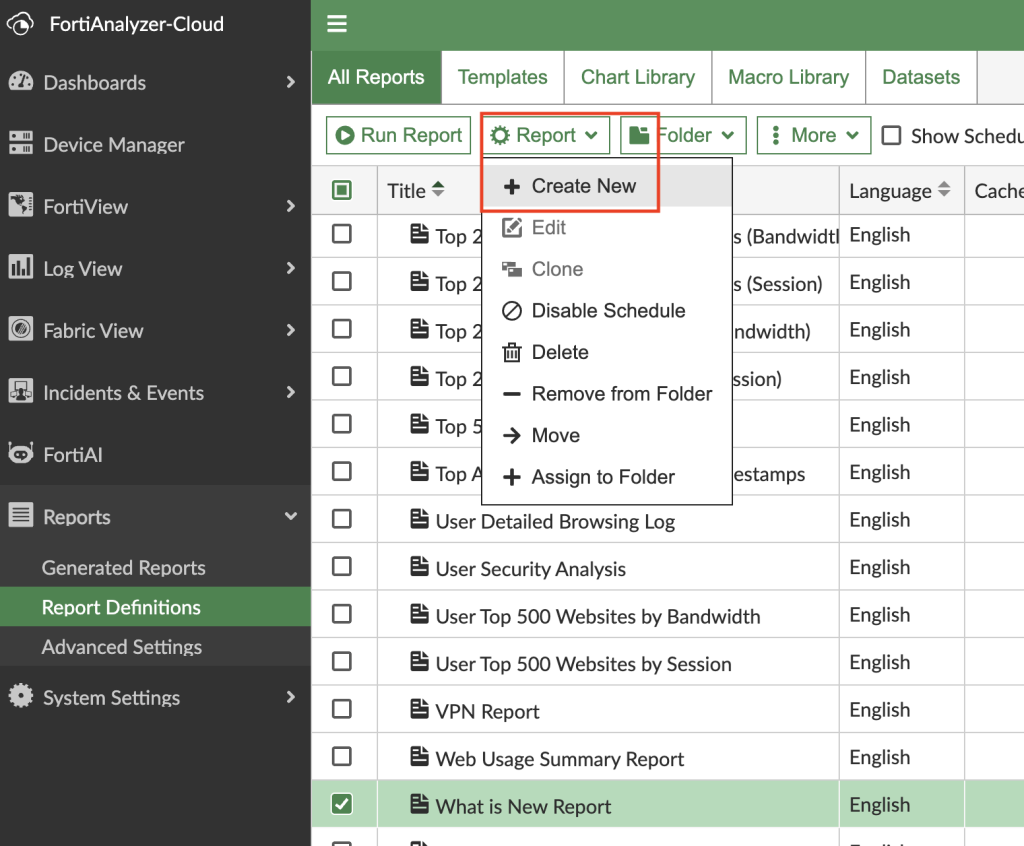
Navigate to Reports > Report Definitions. At the top select the Report drop down and then create new.
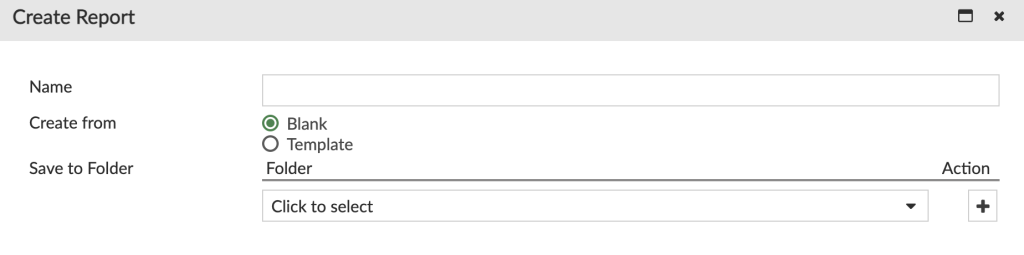
In the window that opens give your report a name and choose a location to save it. I’ve chosen the name ConfigChangeReport and saved in All Reports Folder:
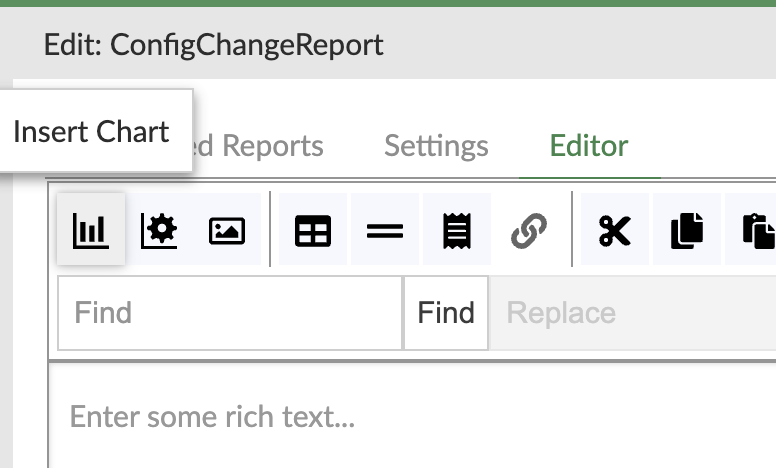
The report editor window opens next, select the Editor tab and Insert Chart
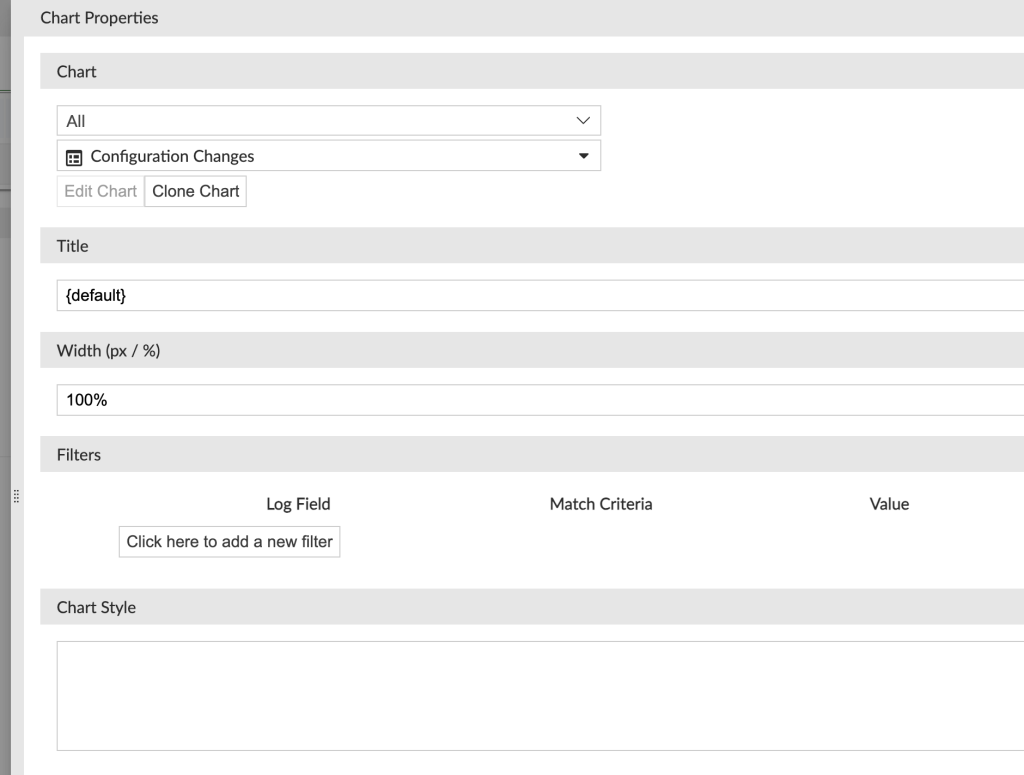
Now, select “Configuration Changes” in the 2nd drop down on the chart properties and click okay
Return to the settings page of the report editor. I’ve configured the time period for the previous 24 hours. Also check the box “Include additional data until the scheduled report run time.” If this is not selected the report will contain data starting at the previous top of the hour to 24 hours previous. For example, if the change occurred 5/8/26 at 5:17pm the report would include data from 5/8/26 5pm back to 5/7/26 5pm and miss some or all the changes. Enabling this option makes sure that the 17minutes prior to the last 24 hours is also captured in the report.
The last option we need to select is “Enable Auto-cache”
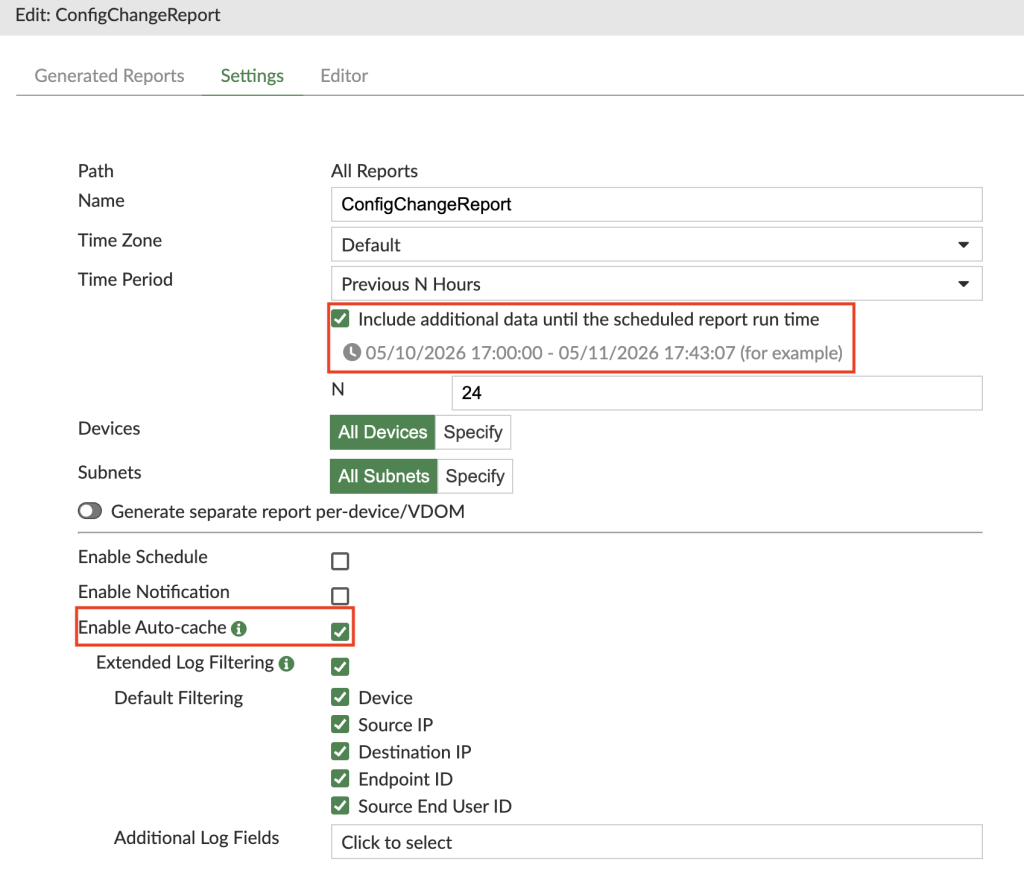
Auto-cache allows FortiAnalyzer to build the cache needed for the report automatically as logs come in rather than build the cache from scratch and compile all the logs when the report runs. The Auto-cache reduces report generation time and is required for reports run by playbooks.
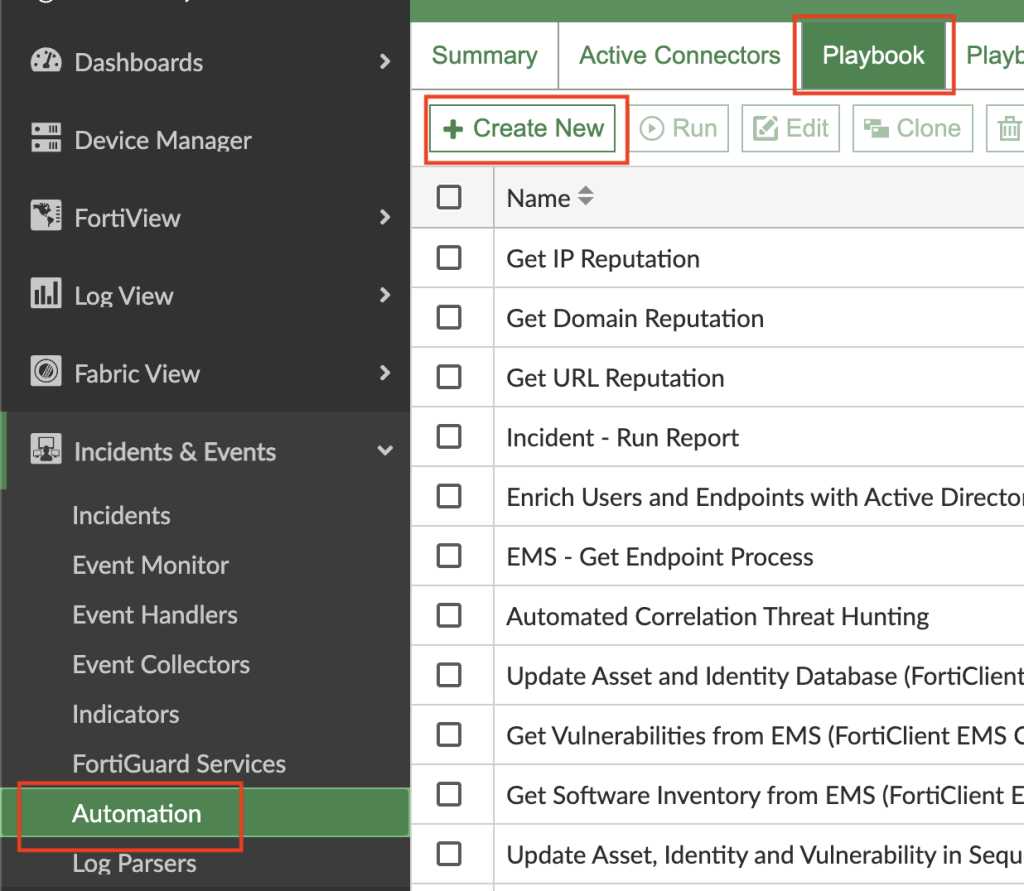
The Event Handler and report needed for this playbook are now complete and we can move on to creating the Playbook. Navigate to Incidents & Events > Automation. Select the Playbook tab and Create New.
In the wizard that opens select Create New Playbook From Scratch, select Event Trigger to start playbook, and select the previously created Event Handler as the trigger.
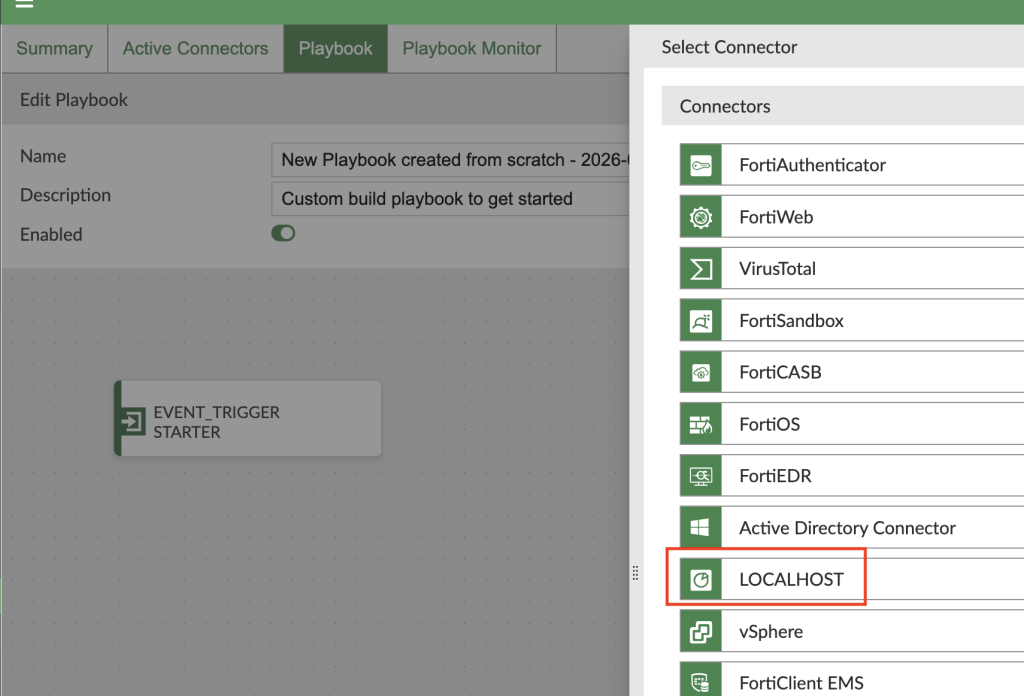
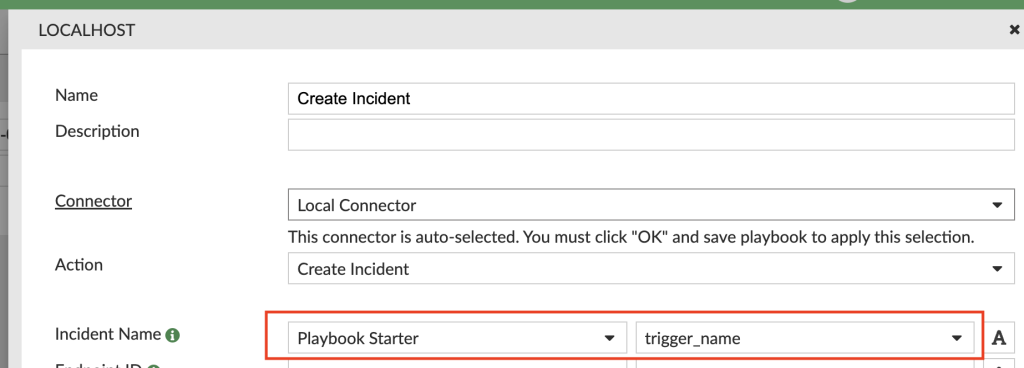
Drag a connector off the event trigger object and select LOCALHOST – this will run locally on FortiAnalyzer. In the connector options set the Action to Create Incident and for incident name I’ve set it to trigger_name which means the Incident name will match the Event Handler name. Category is also required – I’ve set this to Uncategorized.
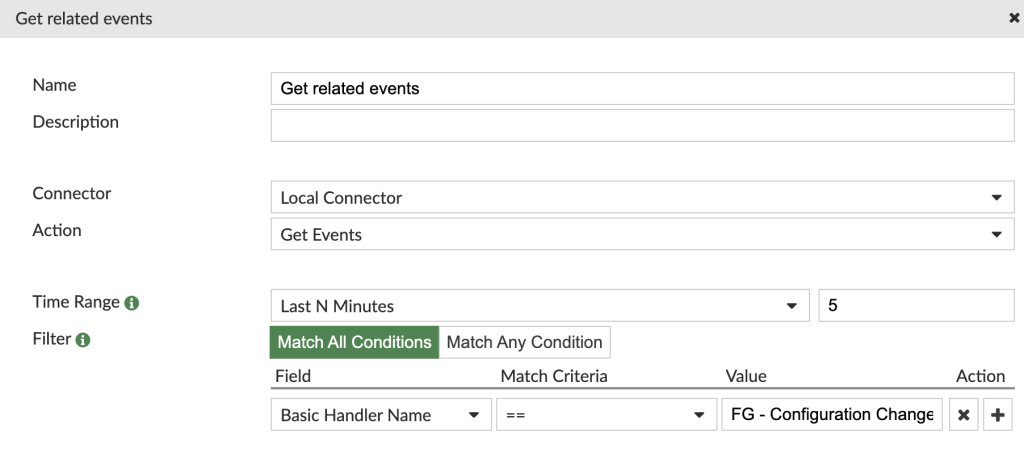
Drag a connector off the Local Host – Create Incident connector and select Local Host again. Set the action to Get Events. Time range I’ve chosen to get the last 5 minutes – there typically will only be 1 log entry for when the admin logged out. I set the time window to 5 minutes in case there is any delay in FortiAnalyzer receiving the logs and kicking off the Event Handler. Set the filter to Match All Conditions and click the “+” to add a filter. Field should be set to Basic Handler Name, Match Criteria to ==, and Value to the Event Handler name.
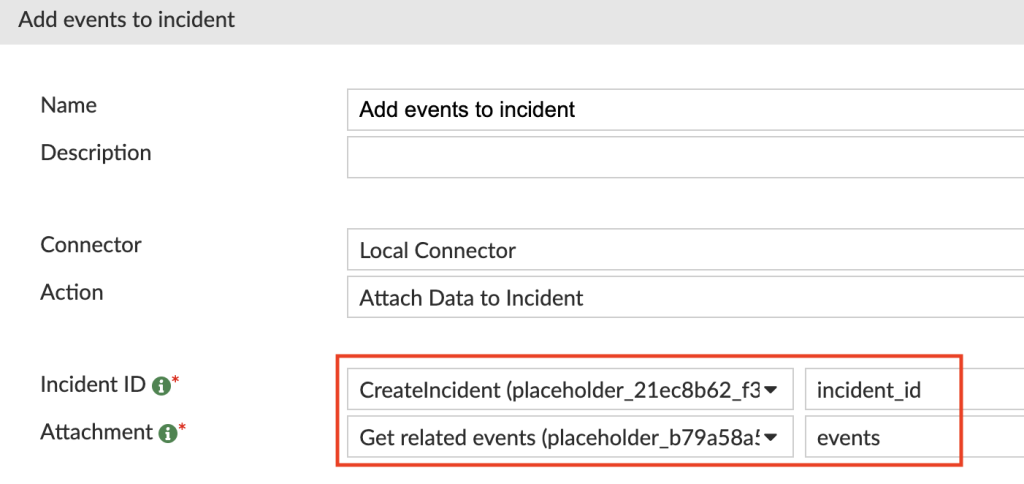
Drag a connector off the Local Host – Get Events connector and select Local Host. Set the action to Add Data to Incident. FortiAnalyzer will allow us to select the 1st local connector we created in the playbook for the incident ID and the 2nd local connector created for the events in the drop-down boxes.
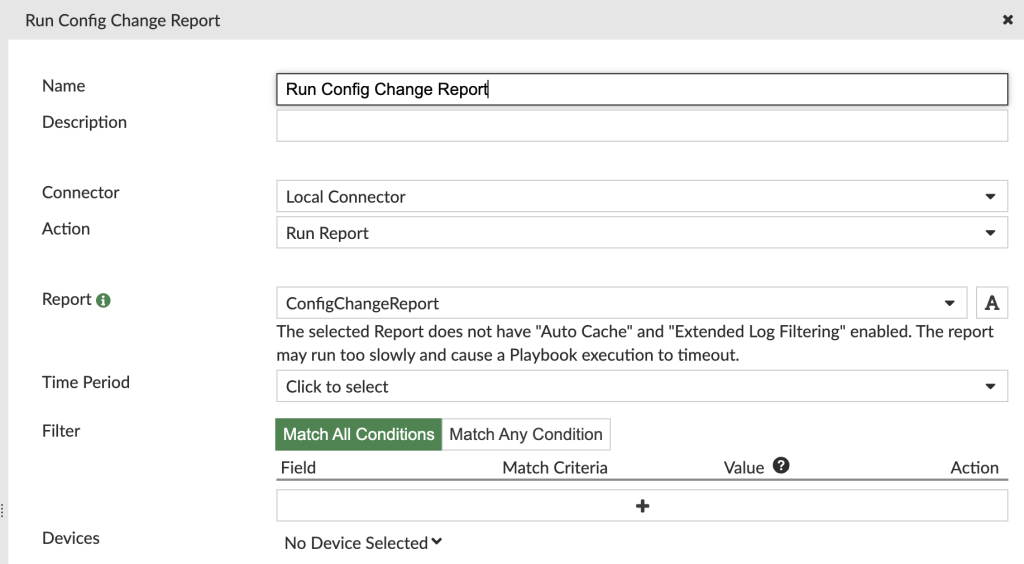
Drag a connector off the Local Host – Attach Data to Incident and select Local Host. Set the action to Run Report. Select the Report created previously (disregard the message in the screenshot about auto-cache and extended log filtering).
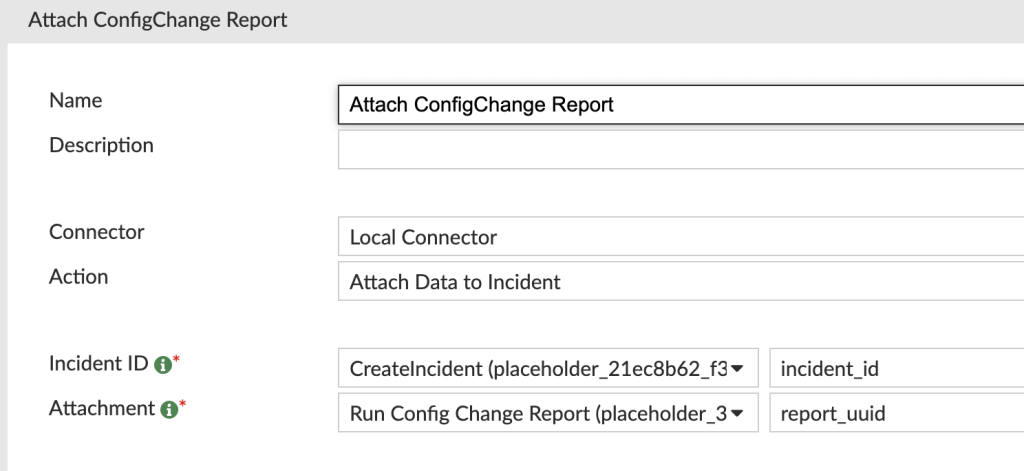
The last step is to add a connector off Local Host – Run Report and select Attach Data to Incident. Again, we will select the connector ID that created the incident for the incident ID. Set the attachment to the connector that ran the report.
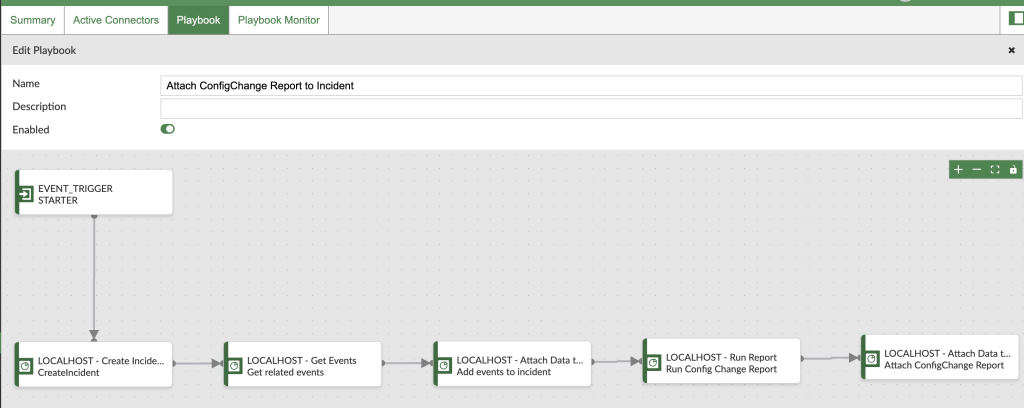
We have successfully built an Event Handler that will detect changes on admin logout and send email notification, a report to capture the changes in the last 24 hours, and a Playbook to create an Incident in FortiAnalyzer, capture the event logs, and attach a report that can be easily exported.
Example Email:
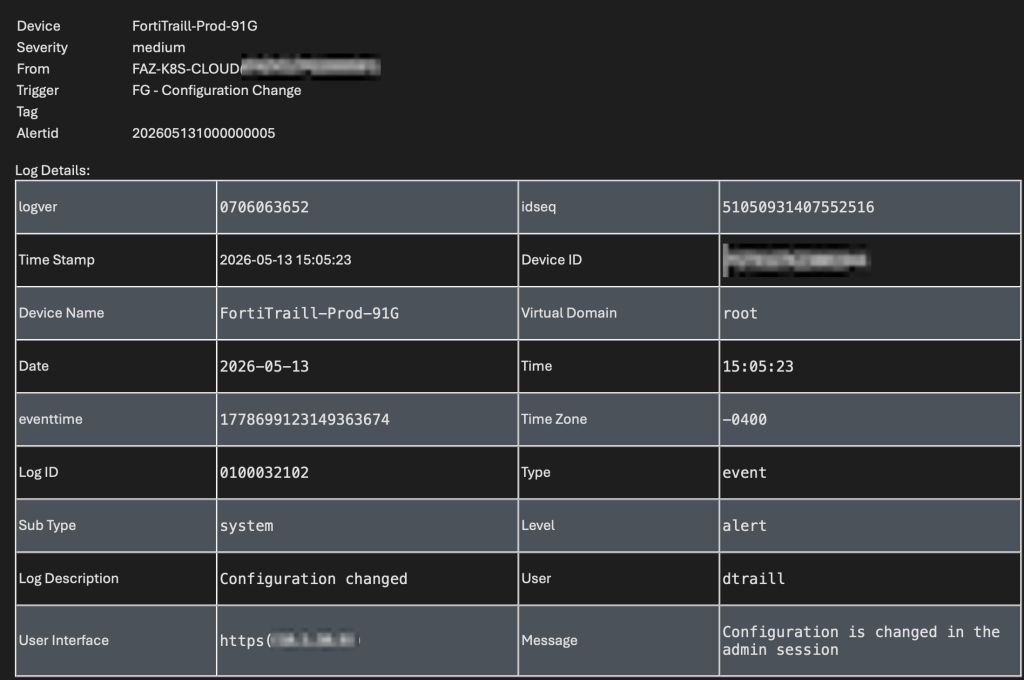
Created Incident in Incidents & Events > Incidents
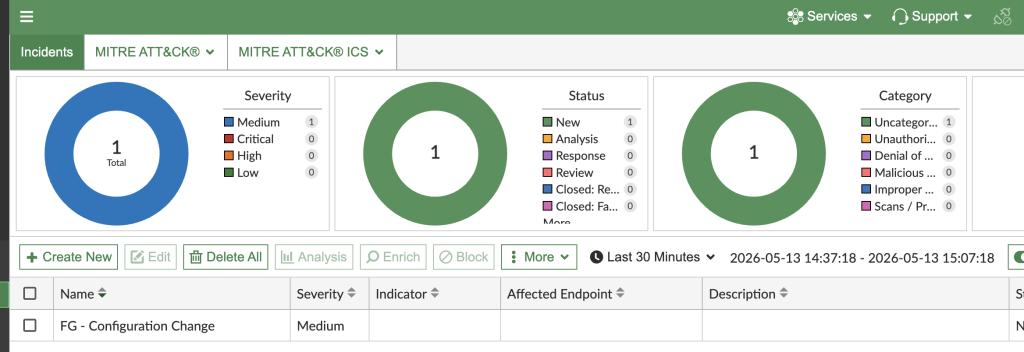
Double click on the incident to view the details
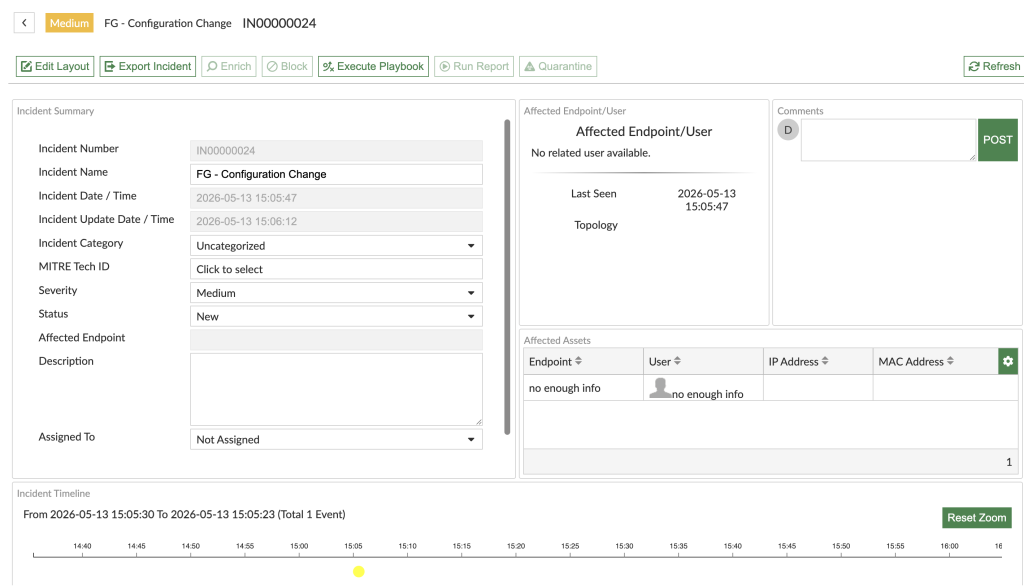
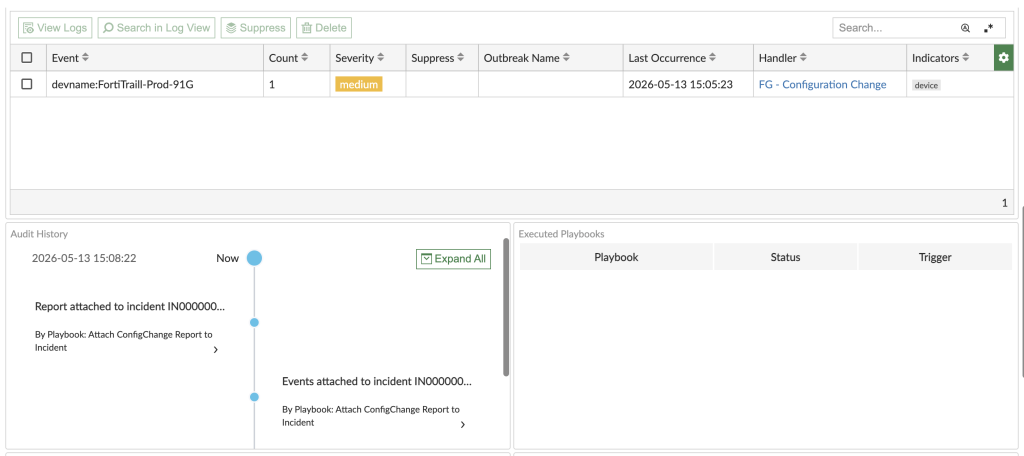
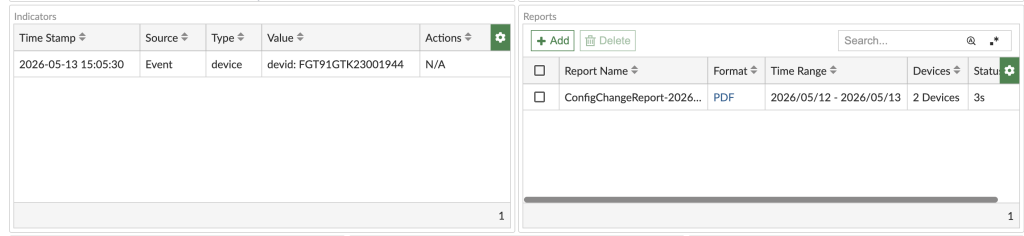
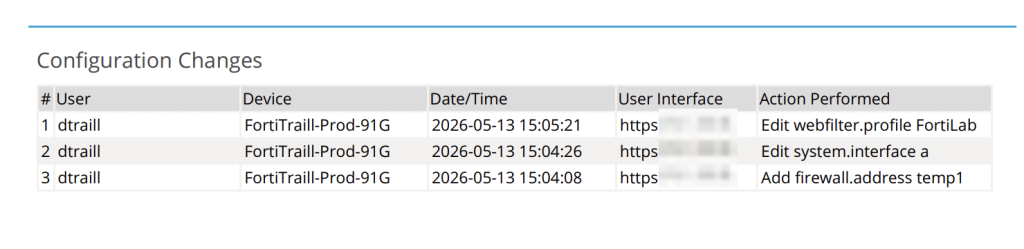
Sample of configuration change table in report
FortiAnalyzer is very powerful in its capabilities to take action on logs and events from your Fortinet products. It also has added support for 3rd party devices via Syslog and similar Event Handlers and Playbooks can be created to detect configuration changes on those devices. I hope this guide serves as inspiration for designing your own playbooks in your environment.